Weight Loss Chart: Daily Dots, a Weekly Line, and How to Read Both
Weight loss chart examples can show daily readings beside a weekly average. Learn how to make a clear chart, label example data, and read both lines.
By Ultimate Fitness Tracker by Cosmo Suite · Editorial policy
Published · 7 min read
General information, not medical or fitness advice. Talk to a qualified professional.
A weight loss chart puts dated readings into a visual record. You can add a calculation beside them, with its own label. The points show the entries. The line summarizes a defined window. The chart records what happened; it does not explain why a reading changed.
When a chart has a jagged line, start with the dates and units. It is easier to follow when the entries are clear. A chart records past values; it cannot predict what comes next.
The Trend Line:
- Keep individual readings as dots so the original entries stay visible.
- Add a separate seven-reading average line to summarize each complete window.
- Label the units, dates, and example data clearly.
- Treat the chart as a tracking record, not an explanation or promise.
What the Numbers Say
A weight chart can show individual entries and a calculated summary, as long as each series has a label. The NIH's National Institute of Diabetes and Digestive and Kidney Diseases (NIDDK) says tracking activity progress on paper or online can help people chart progress over time (NIDDK, "Tips to Keep Moving"). The Centers for Disease Control and Prevention (CDC) describes tracking current information as a way to see where someone is starting (CDC, "Steps for Losing Weight"). Both pages discuss recordkeeping. Neither presents a simple chart as a medical tool.
| Chart element | What it records | What it does not establish |
|---|---|---|
| Daily dot | One dated scale reading | Why that value differs from another |
| Seven-reading line | The mean of seven selected readings | A cause or future result |
| Date label | When an entry was made | Whether conditions were identical |
| Unit label | Pounds, kilograms, or another chosen unit | A comparison if units were mixed |
| Optional note | A detail the person chose to remember | Proof that the detail caused a change |
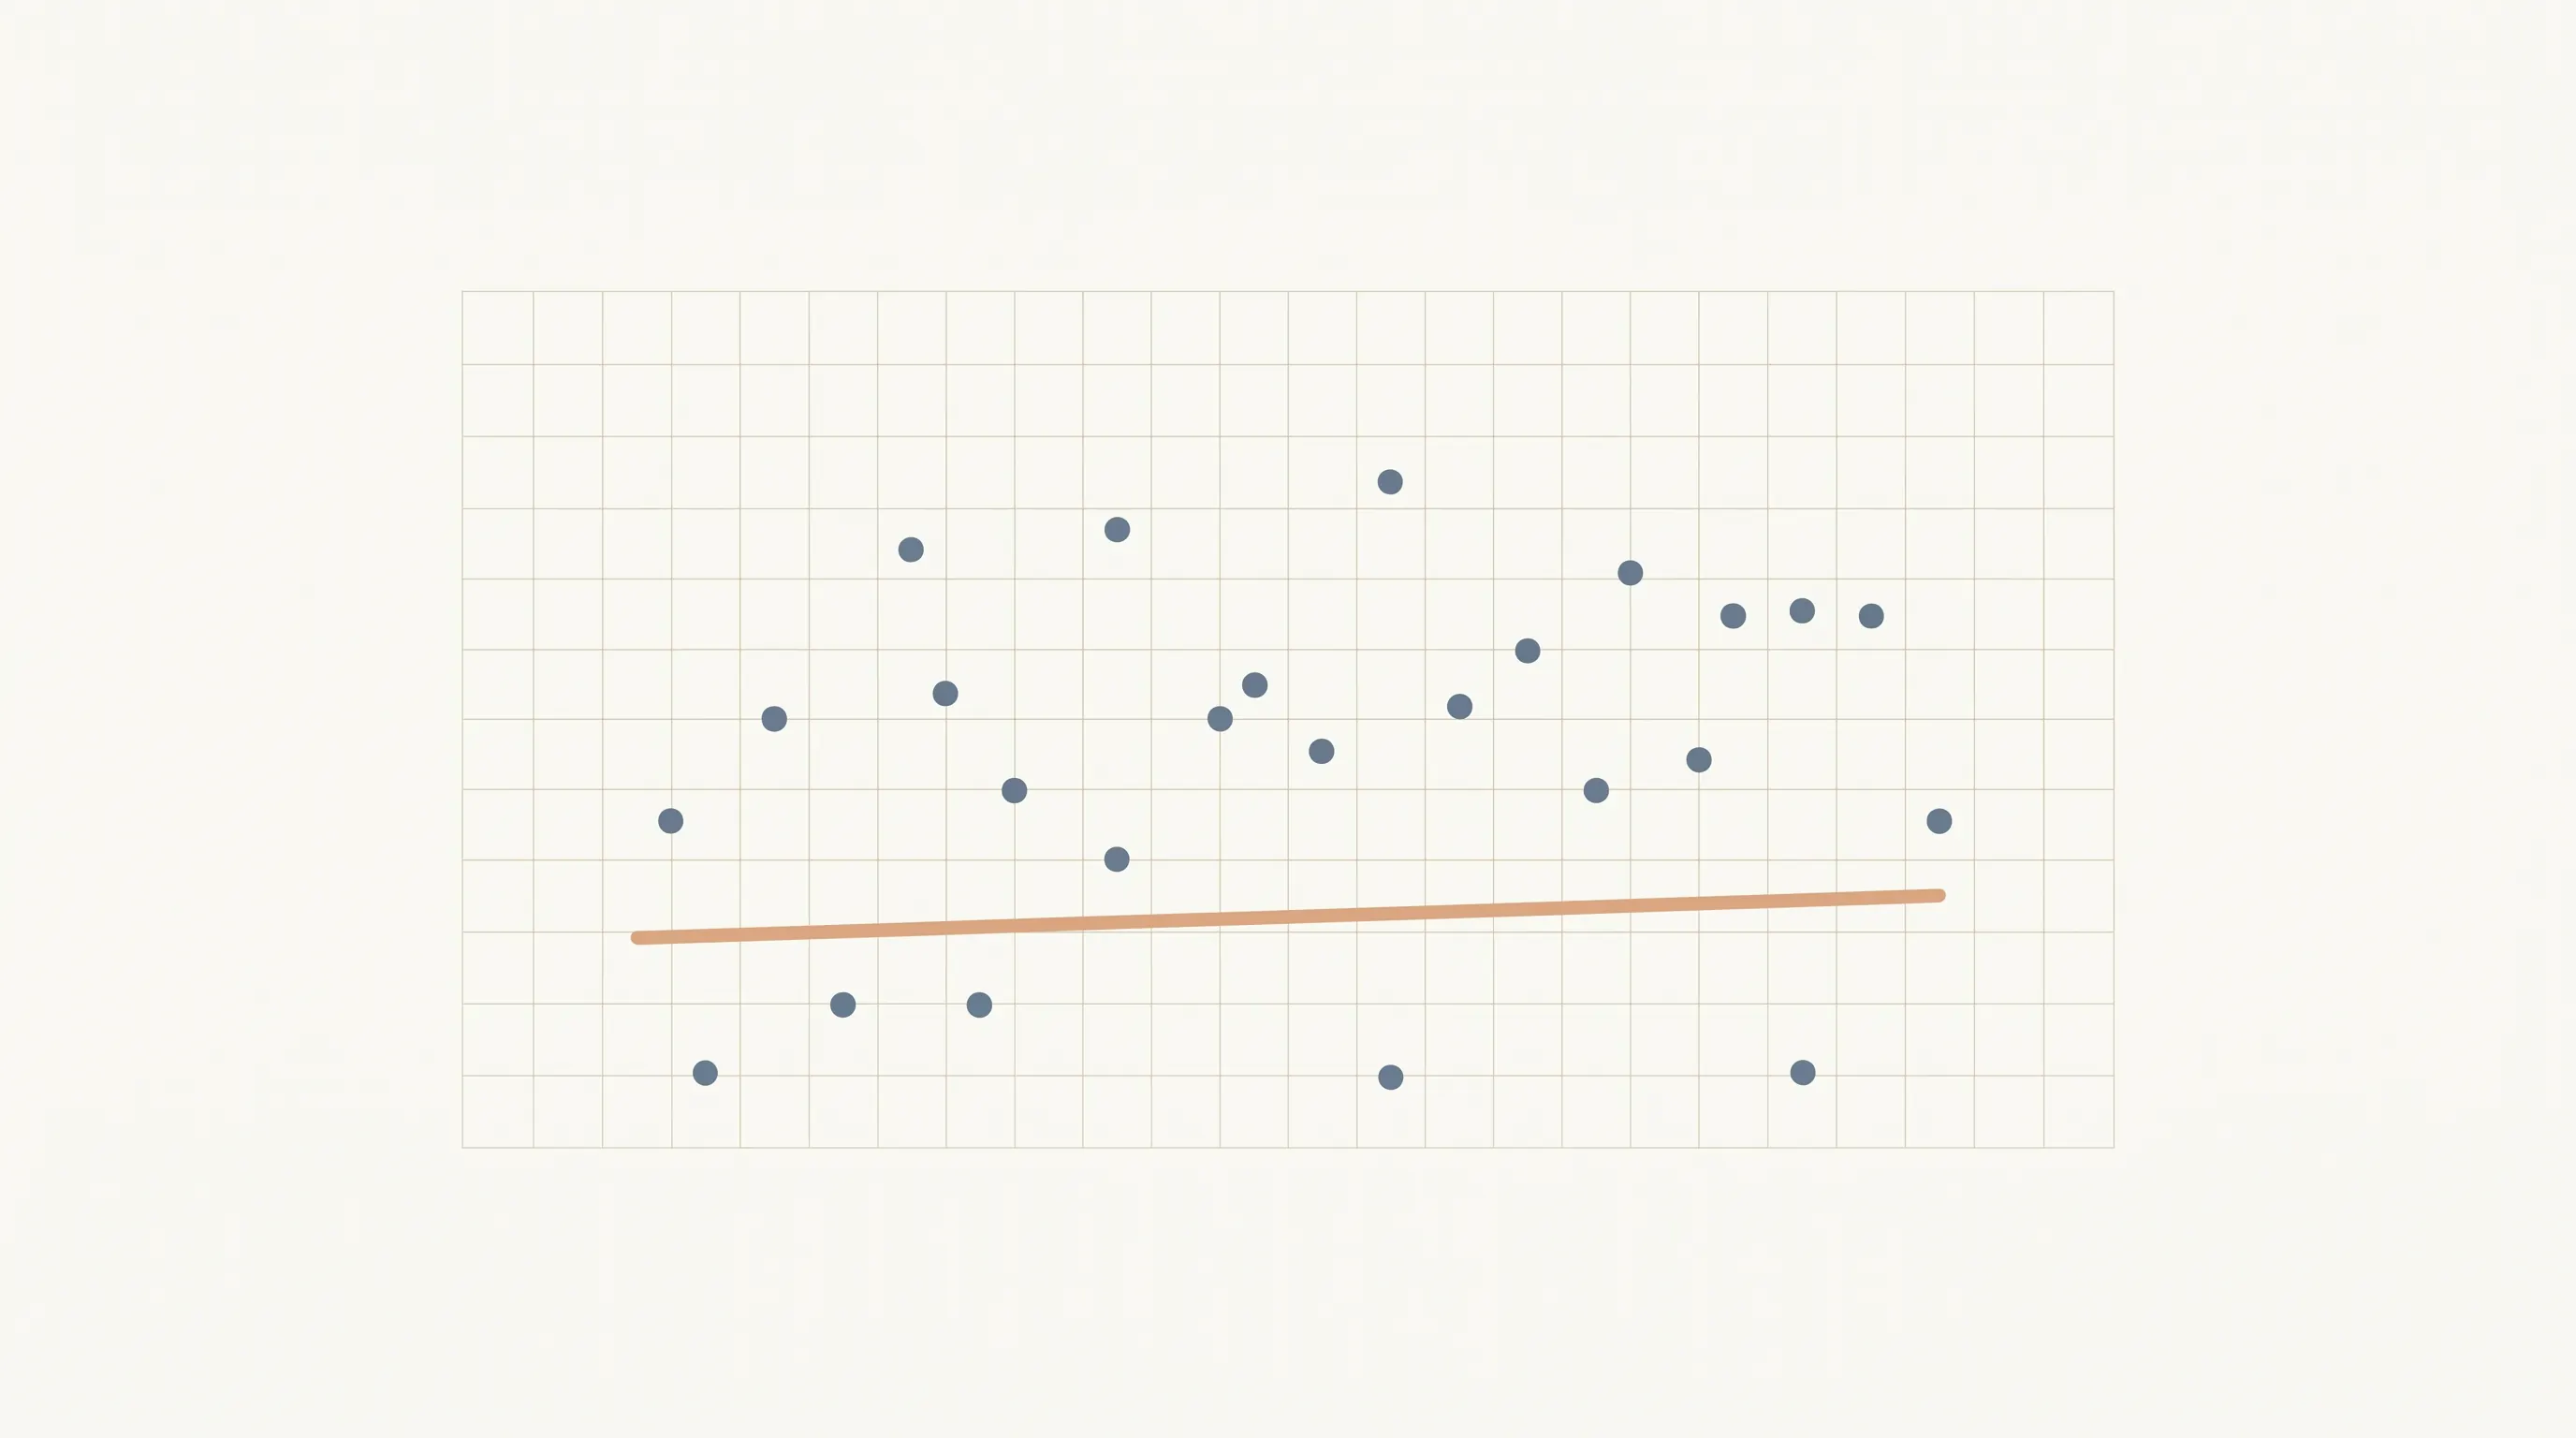
Keep every dot in view. A summary line is easier to read when the points behind it have not been hidden. If you want a broader record, the weight loss tracker spreadsheet example shows how weigh-ins can sit beside other tracking fields.
How Do You Make a Weight Loss Chart?
Start with a small table, then make a chart from its date and reading columns. The first job is recording each value consistently. The chart can only reflect what was entered.
| Date | Example reading (kg) | Seven-reading average (kg) |
|---|---|---|
| 1 to 7 | 81.2, 81.0, 81.4, 81.1, 80.9, 81.3, 81.0 | 81.1 |
| 8 to 14 | 80.8, 81.2, 80.9, 81.1, 80.7, 81.0, 80.8 | 80.9 |
These values are fictional example data. The first seven readings total 567.9 kg. Divide that by seven to get 81.13 kg, or 81.1 kg rounded to one decimal place. The next seven total 566.5 kg. Dividing by seven gives 80.93 kg, or 80.9 kg rounded to one decimal place. The averages differ by about 0.2 kg, or 0.4 lb. Those figures describe this example alone.
To build the chart, put dates in one column and readings in another. Use one unit throughout. Make a line chart or scatter plot from the daily readings. Add the average as another series and label it. If the charting tool connects the average points, name it a seven-reading average line so people know what it represents.
For a rolling seven-reading line, calculate the first average after the seventh entry. On the next date, remove the oldest value and add the newest one. The window moves from days 1 to 7 to days 2 to 8. Each plotted average uses seven entries, so the method stays the same as the dates change.
For a hand-drawn chart, mark the dates along the bottom and the chosen unit along the side. Pick a scale that shows the entries without crowding them. Write the average beside the appropriate point or draw it as a second line. A simple legend can distinguish the daily readings from the average. Before you finish, ask: can another reader identify the raw readings, average window, unit, and missing days at a glance? If any answer is no, add the label that is missing.
The weight loss tracker template guide compares the fields a tracking format can hold. Either a notebook or spreadsheet can keep the dated values. A sheet can also calculate the summary after its formula is set up.
How Should You Read the Dots and Line?
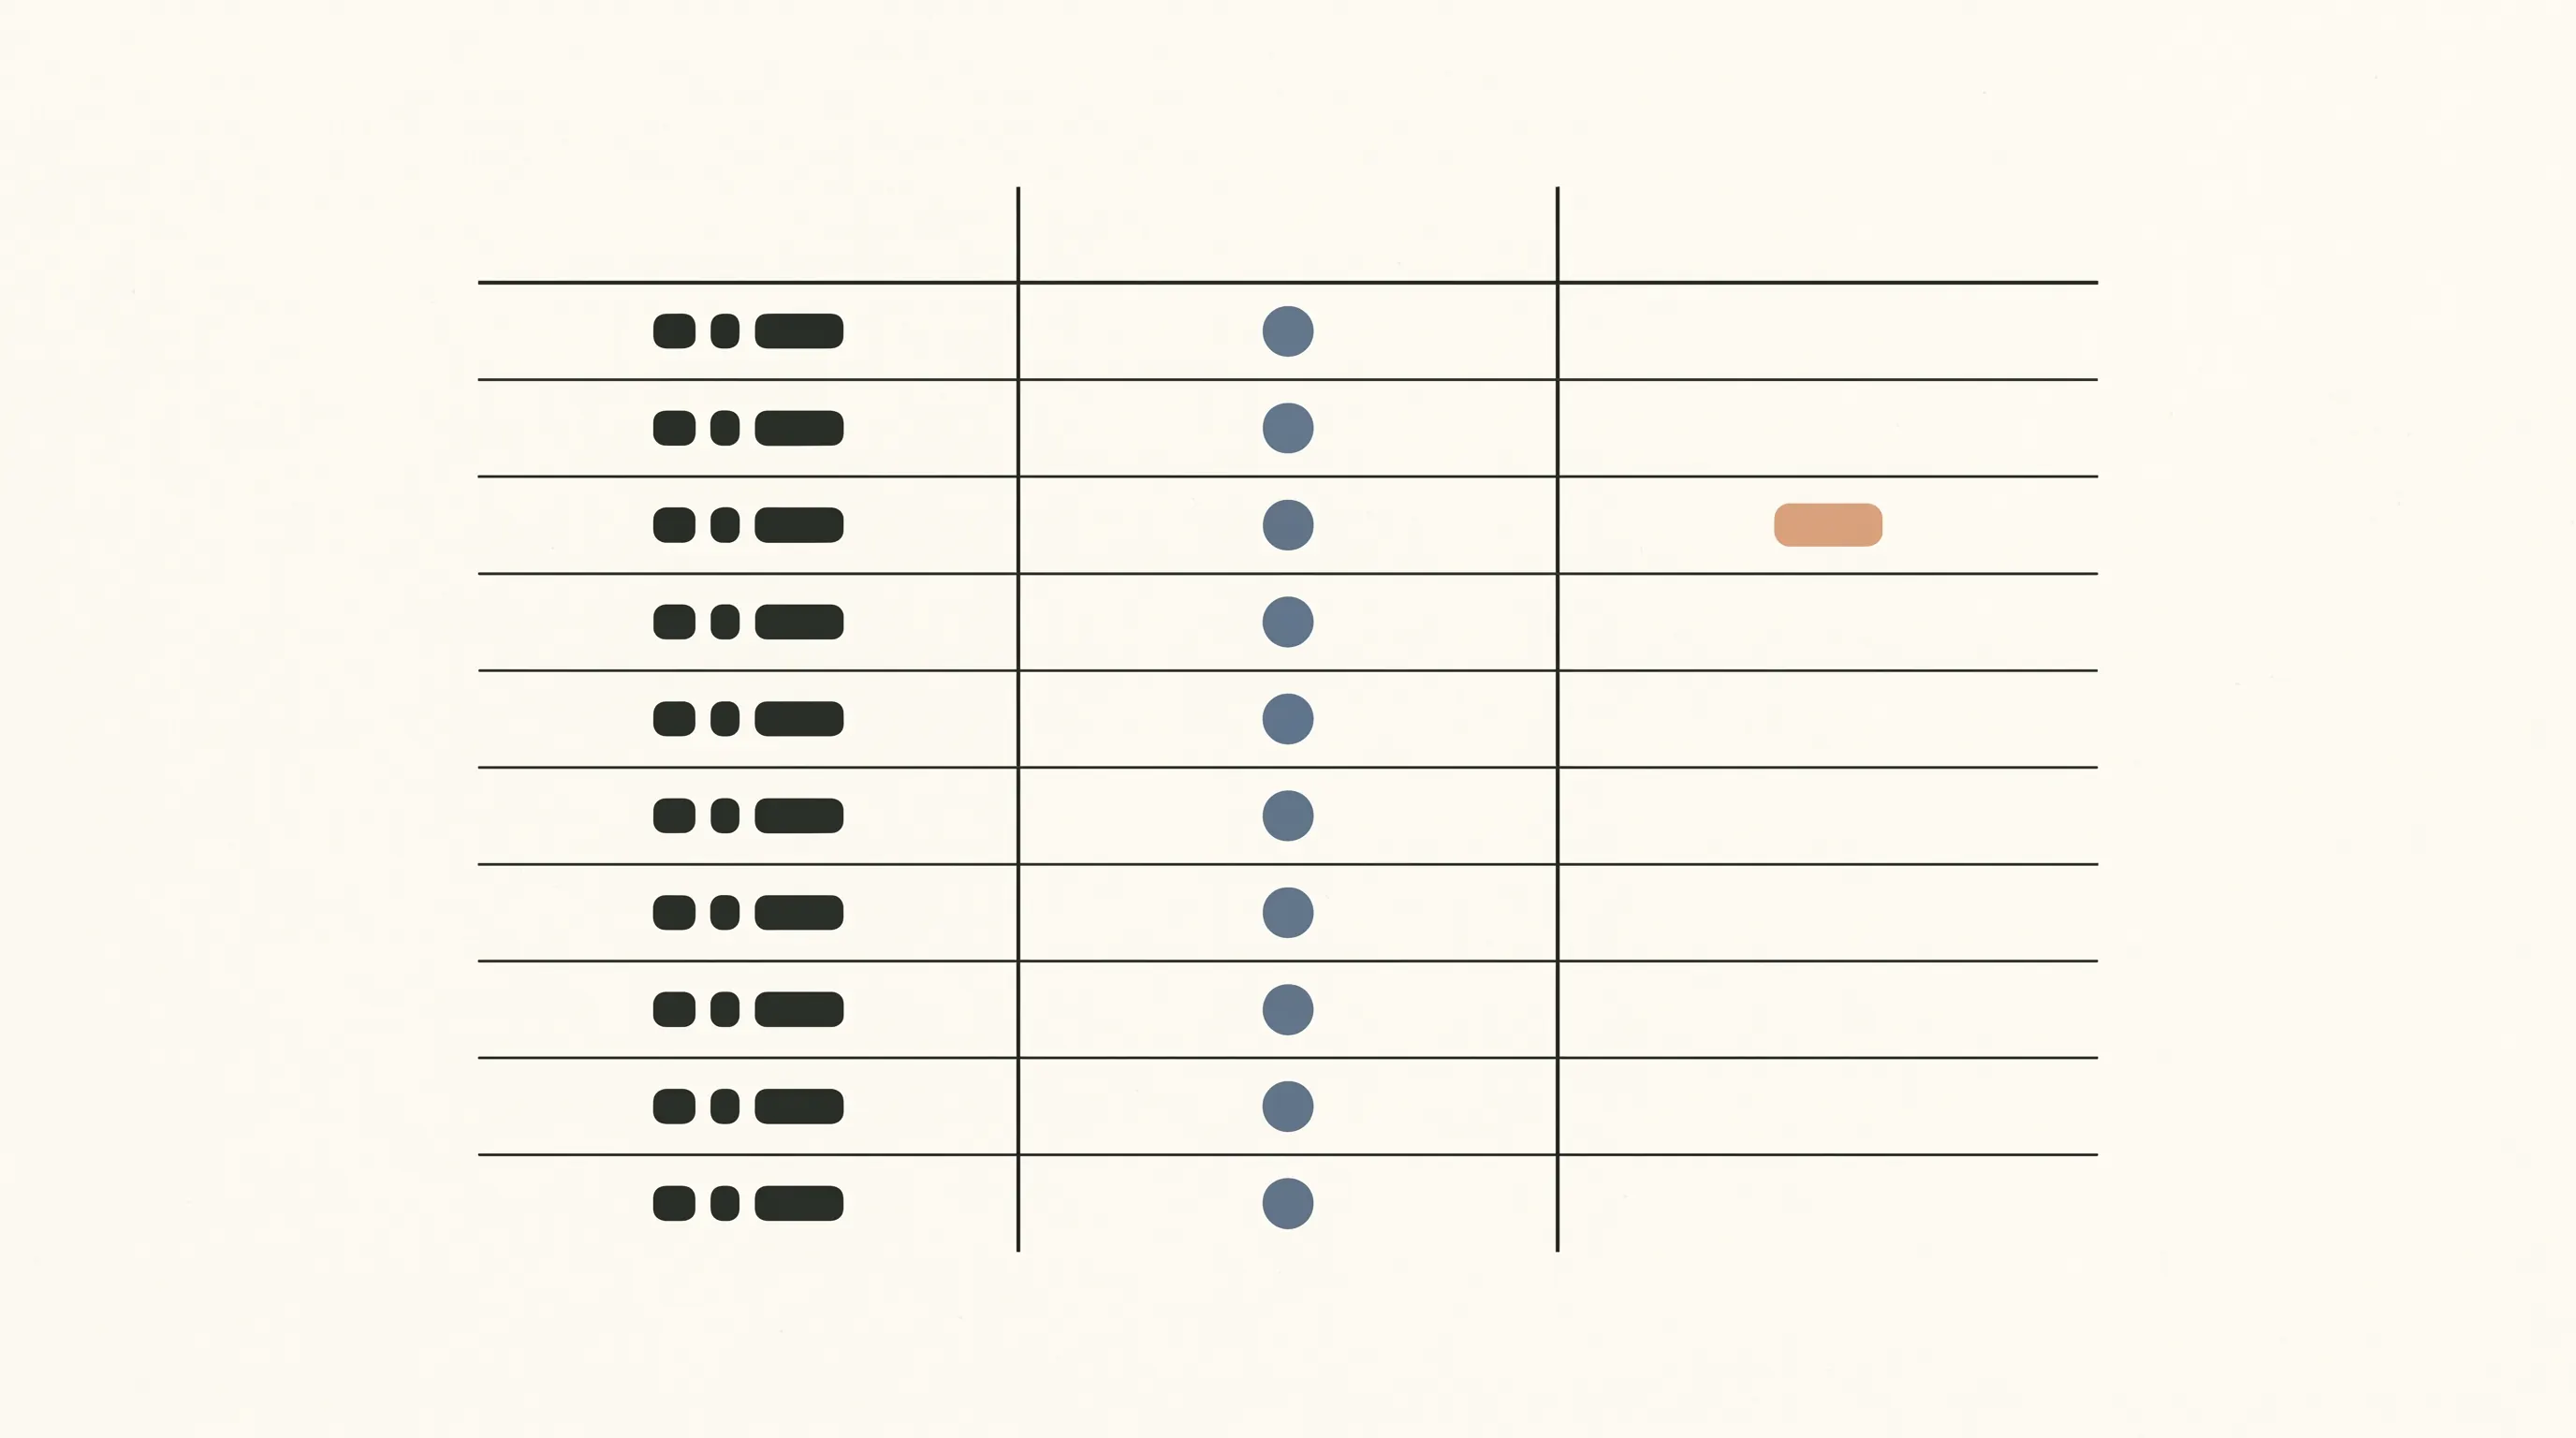
Read the dots as entries and the line as a calculation. A dot belongs to one date. A seven-reading average belongs to a group of seven readings, so it changes only as the window changes.
For example, the first group includes a daily value of 81.4 kg and a seven-reading average of 81.1 kg. The dot is one entry. The average uses all seven values. Both belong on the chart because they answer different questions about the selected readings.
Look at the date labels before comparing two points. A missing day should remain blank. Entering zero would add a value that was never recorded and would distort the calculation. A shorter average is possible, but label it with the number of readings rather than calling it a seven-reading average.
NIDDK's page on tracking progress recommends recording activity details to chart progress over time. The CDC's page on tracking where you are also discusses keeping records. These are examples of recordkeeping guidance, not evidence that a particular weight chart diagnoses a health issue or forecasts a result.
What Makes a Weight Chart Hard to Use?
Mixed units, unlabeled summaries, and missing dates make a chart harder to interpret. A reader should be able to tell what each point means without guessing.
- Mixing units: Keep all plotted readings in pounds or all in kilograms. If you convert, convert every entry before calculating the average.
- Hiding the daily points: A smooth summary may look neat, but the original readings show the entries used in the calculation.
- Calling a summary a trend prediction: A line through past values only represents past data. It does not forecast what comes next.
- Filling blanks with zero: A missing entry is unknown, not a zero reading. Keep the cell blank or mark it as missing outside the calculation.
- Changing the window quietly: Seven values and fourteen values produce different summaries. State the window beside the line.
The NIDDK Body Weight Planner is a separate planning tool with its own purpose and disclaimer. It allows users to make personalized calorie and physical-activity plans; it is not the same as a chart of recorded values. A simple chart should not be presented as an equivalent calculator or as health guidance. Keep its job narrow: record dates and values, then show the calculation you selected.
What Actually Makes a Chart Useful?
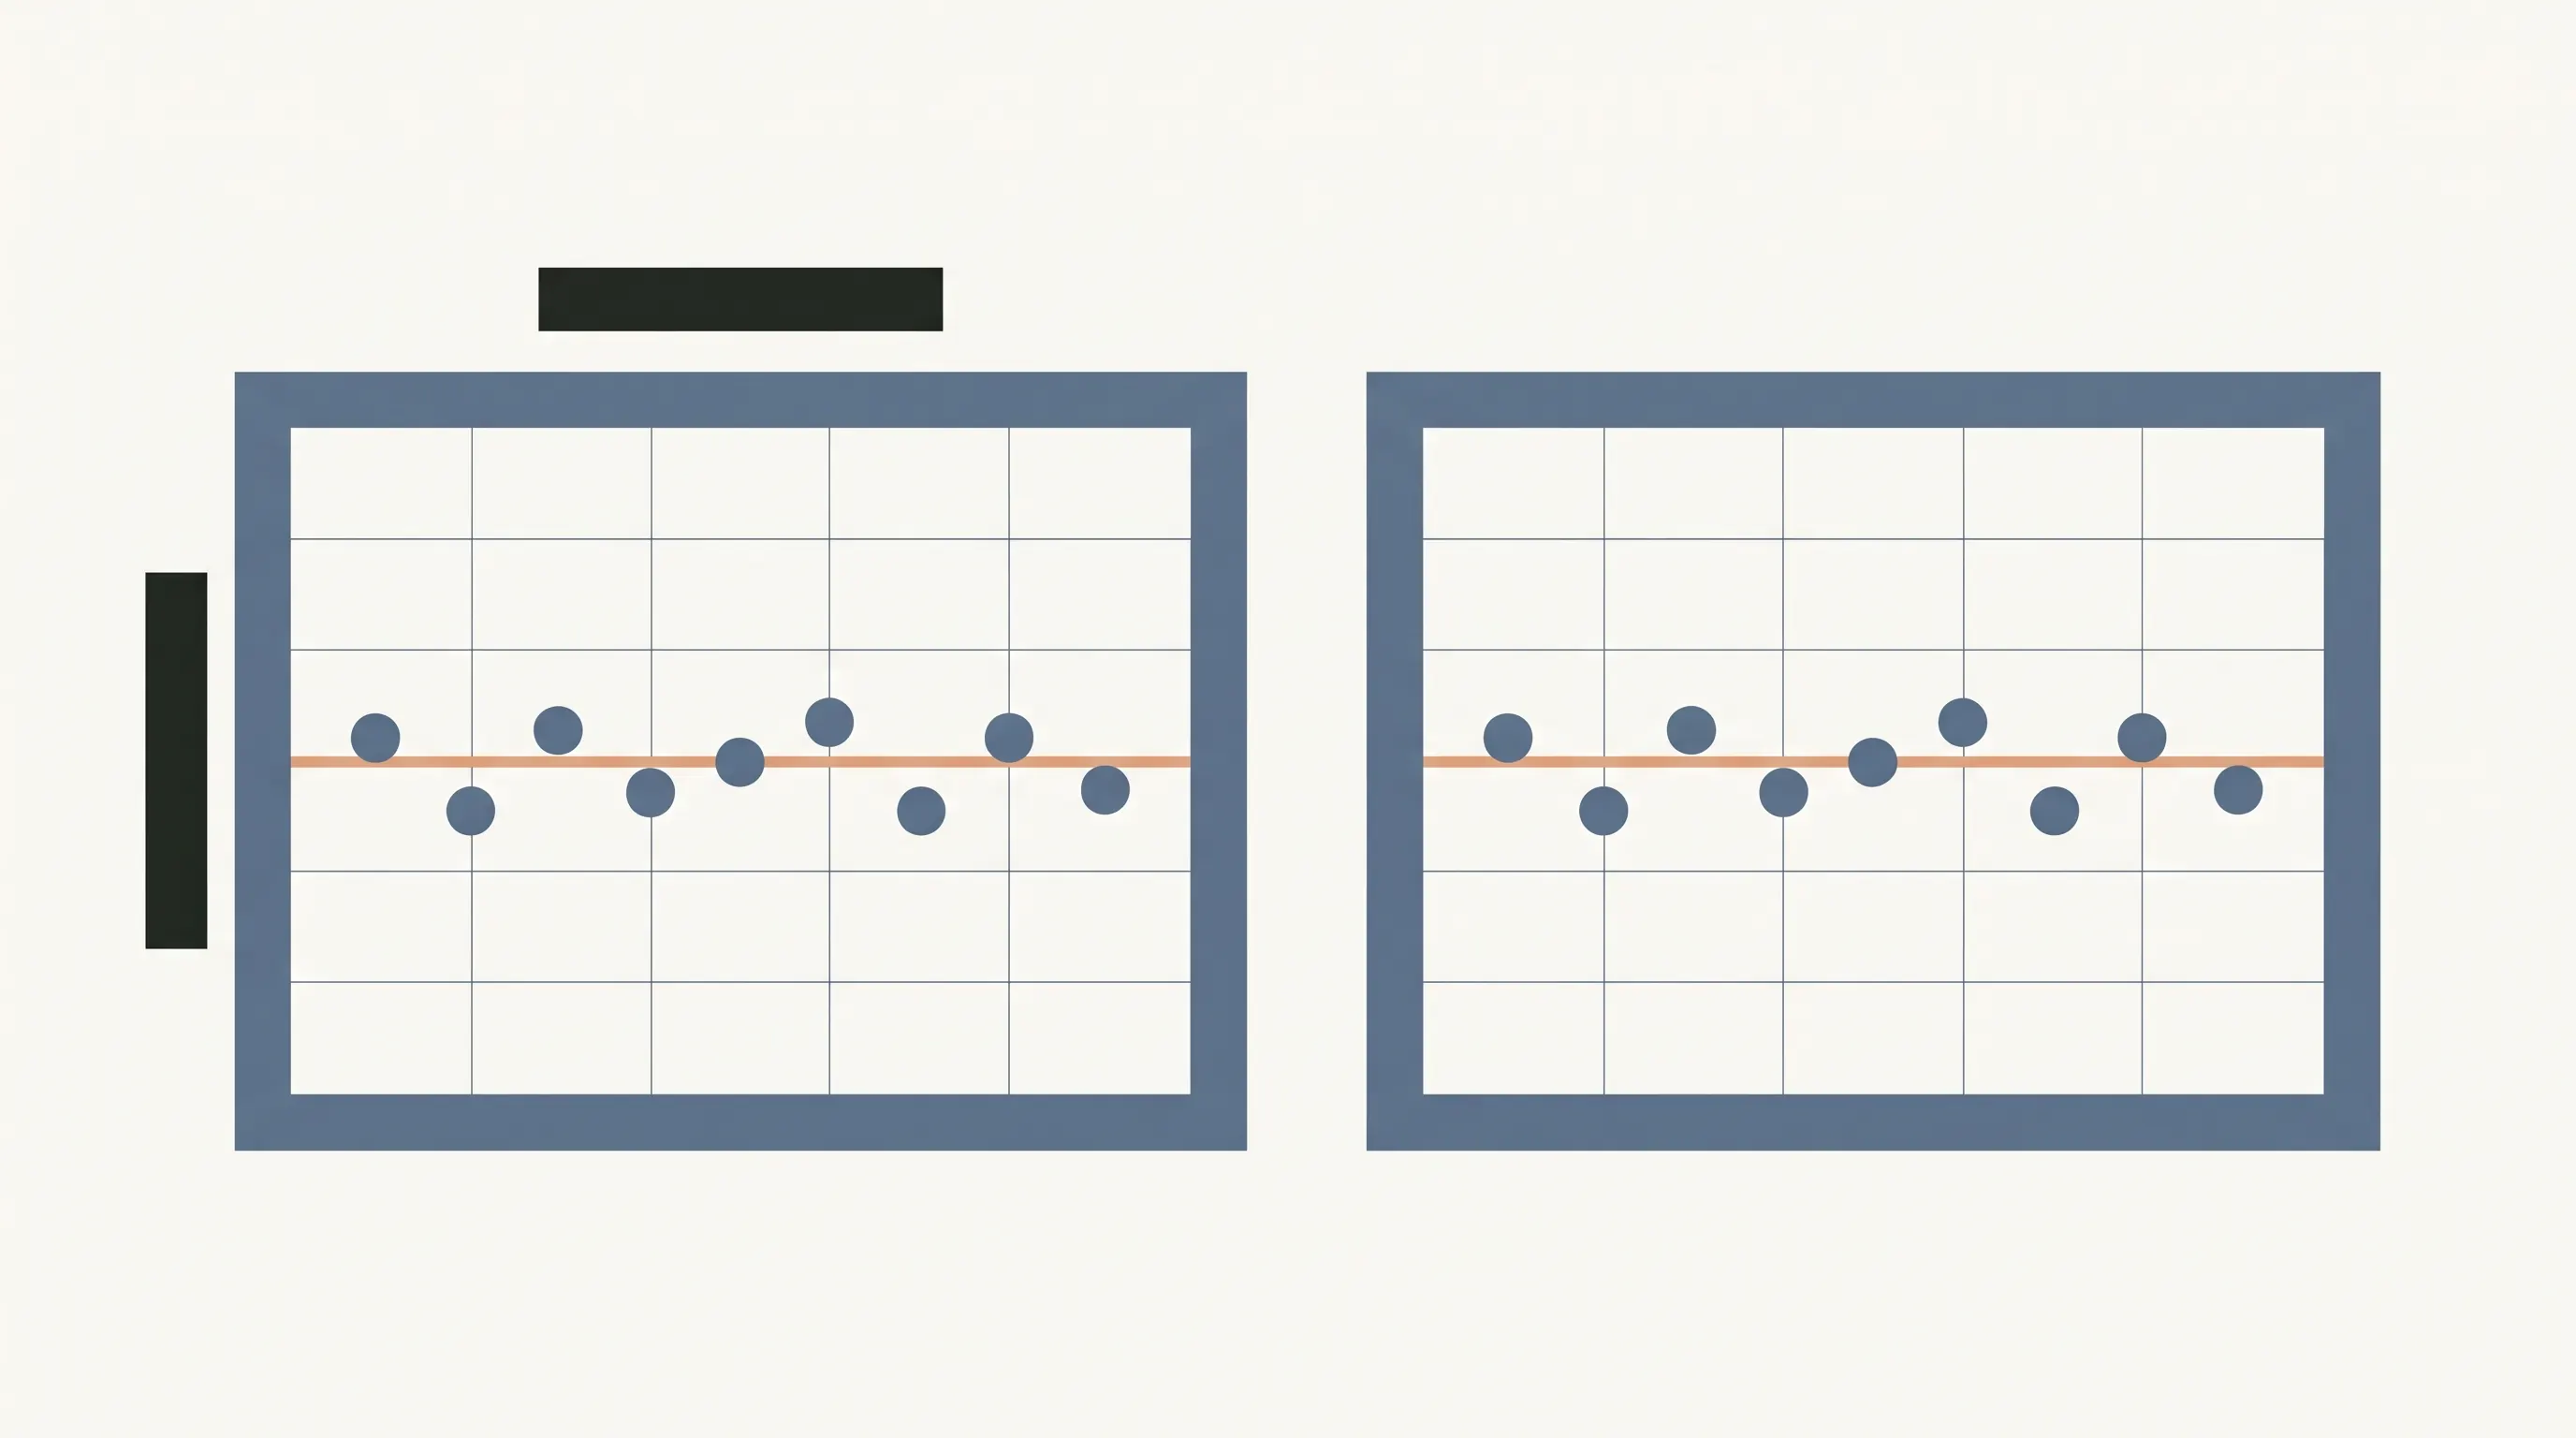
Clear labels and a visible calculation make a chart easier to check. The daily dots show the raw record; the average line lets you compare grouped readings without hiding the entries.
Show the window. Name the number of readings used in the average. A seven-reading window is easy to explain, but the chart should say what it uses.
Keep dates attached. Put the date next to each value in the source table. If a reading is missing, leave it missing. A chart should not invent an entry to keep the line smooth.
Choose one unit. Use the same unit in the table, average, axis, and captions. Readers in the UK may prefer stone and pounds; a chart can show that unit if it stays consistent.
Label examples. If a graphic uses made-up values to demonstrate a method, call them example data near the chart. Do not imply that the values represent a typical pattern.
Keep the method visible. State that the average is the sum of the included readings divided by the count. This lets someone check the figure with a calculator or by hand.
The weight loss tracker chart and spreadsheet overview keeps a seven-day average beside each weigh-in. Its purpose is to organize the record in a file; the figures remain entries for personal tracking.
Why Trust This Article
The Cosmo Suite team made the Ultimate Fitness Tracker spreadsheet. The About page names the publisher, and the editorial policy explains how posts are checked. This article explains chart arithmetic and recordkeeping, not medical or fitness advice. NIDDK and CDC pages were checked on November 8, 2026. The example readings are fictional and exist only to show the calculation. For a correction, use the site's contact page. Verify any health question with a qualified professional.
Where the Ultimate Fitness Tracker Fits
The Ultimate Fitness Tracker is a weight loss and workout spreadsheet for Google Sheets and Excel. Its Weight Loss Tracker tab keeps weigh-ins with a seven-day average and weekly trend line. The file also includes measurements, progress photos, and workouts with what you lifted last time.
That combination can help when you want a record with more than plotted weigh-ins. The chart method above still works on paper or in another spreadsheet. The Ultimate Fitness Tracker puts the average beside each weigh-in and lets the reader keep a copy of the file.
See the spreadsheet for recording weigh-ins with a seven-day average if you want those fields arranged in one file. Ultimate Fitness Tracker includes 11 connected tabs in Google Sheets and Excel, plus three printable bonus pages.
Frequently asked questions
What should a weight loss chart show?
A basic chart can show dated readings as individual points and a separately labeled summary, such as an average of seven readings. Keep the dates, units, and calculation window visible so the summary is easy to interpret.
How do I make a weight loss chart in a spreadsheet?
Put each date and reading in its own row, keep one unit throughout, then chart the daily values. Add a separate seven-reading average series if you want a summary line. Label fictional examples clearly.
How do I calculate a seven-day average?
Add the seven readings in the window and divide by seven. If a reading is missing, do not treat it as zero. Wait until you have seven values or label a shorter window accurately.
Should I use pounds or kilograms on a chart?
Either can work. Choose one unit for the chart and label it beside the axis. If you switch units, convert every point consistently before comparing the line.
Does a chart explain why a number changed?
No. A chart displays recorded values and any calculation you add. It cannot identify a cause, diagnose a condition, or predict a future result.
Can I use a paper chart instead of a spreadsheet?
Yes. Paper works for dated points and handwritten notes. A spreadsheet can calculate a rolling average for you, while a paper chart needs the arithmetic entered by hand.
Sources
Keep reading
Weight Loss Tracking
Weight Loss Tracker Spreadsheet: Track the Trend, Inches and Workouts in One File
Weight loss tracker spreadsheet template: the 7 fields it needs, the 7-day average formula, and a 14-day worked example for Google Sheets and Excel.
· 7 min read
Weight Loss Tracking
Weight Loss Tracker Template: What a Good One Tracks Besides the Scale
Weight loss tracker template checklist: 7 fields a good one needs, scored across printable, Notion and spreadsheet formats, with a worked example log.
· 7 min read
Weight Loss Tracking
Printable Weight Loss Tracker: When Paper Works and When You Need the Math
Printable weight loss tracker guide: compare a paper weigh-in page with a spreadsheet, then work through a 7-day average and change since start.
· 8 min read
